Professional Experiences

Employee Engagement

I believe strong cultures are built, not inherited. Through events, panels, and engagement efforts, I work to make workplaces more inspiring, more inclusive, and more human.

Woman giving a presentation on stage with a wooden floor and black background.
Group of people posing for a photo inside a John Deere building with a large John Deere logo on the wall in the background.
Red poster for a Women in Tech panel event. Features a title and event details, including date, time, location, and pizza provision. Photos of six women with labels showing their names and affiliations. Panel moderated by Sharon Li, Computer Sciences. Logos of the School of Computer, Data & Information Sciences, University of Wisconsin-Madison, and ACM-W are at the bottom.

Power BI

My Power BI work goes beyond charts and graphs. It’s about enabling better business conversations by building dashboards that are easy to navigate, easy to understand, and hard to ignore.

John Deere MLFP Metrics dashboard showing dealership data, account counts, part recommendations, and sell through metrics with graphs and summary statistics.
Screenshot of a market exploration dashboard showing claims overview with brand and product counts, certification status, claim synonyms, and top product categories and brands.
Screenshot of a John Deere report showing filters for region and ship unit, and tables and graphs of order type codes, parts, and data trends over time, with data from 2022 to 2025.

Industrial Design

This section reflects my passion for visual storytelling, systems thinking, and product innovation. Each design phase was guided by the voice of the customer, the needs of the market, and the legacy of the John Deere brand.

Comparison of two autonomous street cleaning robots, one without a cab and one with a protective cab, both featuring similar design, large wheels, and advanced mechanisms.
Four green John Deere riding lawn mowers with yellow seats arranged against a white background. Some are shown from a side view, and they have various attachments and features, including a blade and a grass collector.

Processes

I take pride in making technical complexity approachable. These examples demonstrate how I organize thinking, visualize systems, and create documentation that supports long-term success.

Comparison chart of Metrics Mart current and future states, showing data sources, platforms, user roles, and tools for reporting and analytics in business intelligence.
A presentation slide about Power BI reporting design language, listing covered topics such as color schemes, fonts, page layouts, date and time formats, data sources, and a link to guidelines. It also mentions downloadable Power BI template and theme files.
A detailed infographic showing a part number example, including parts like part number, base country, current cost, AR cost spectrum, part count, AR CPR spectrum, and dataset and spectrum averages, with labeled steps and a spectrum graph.

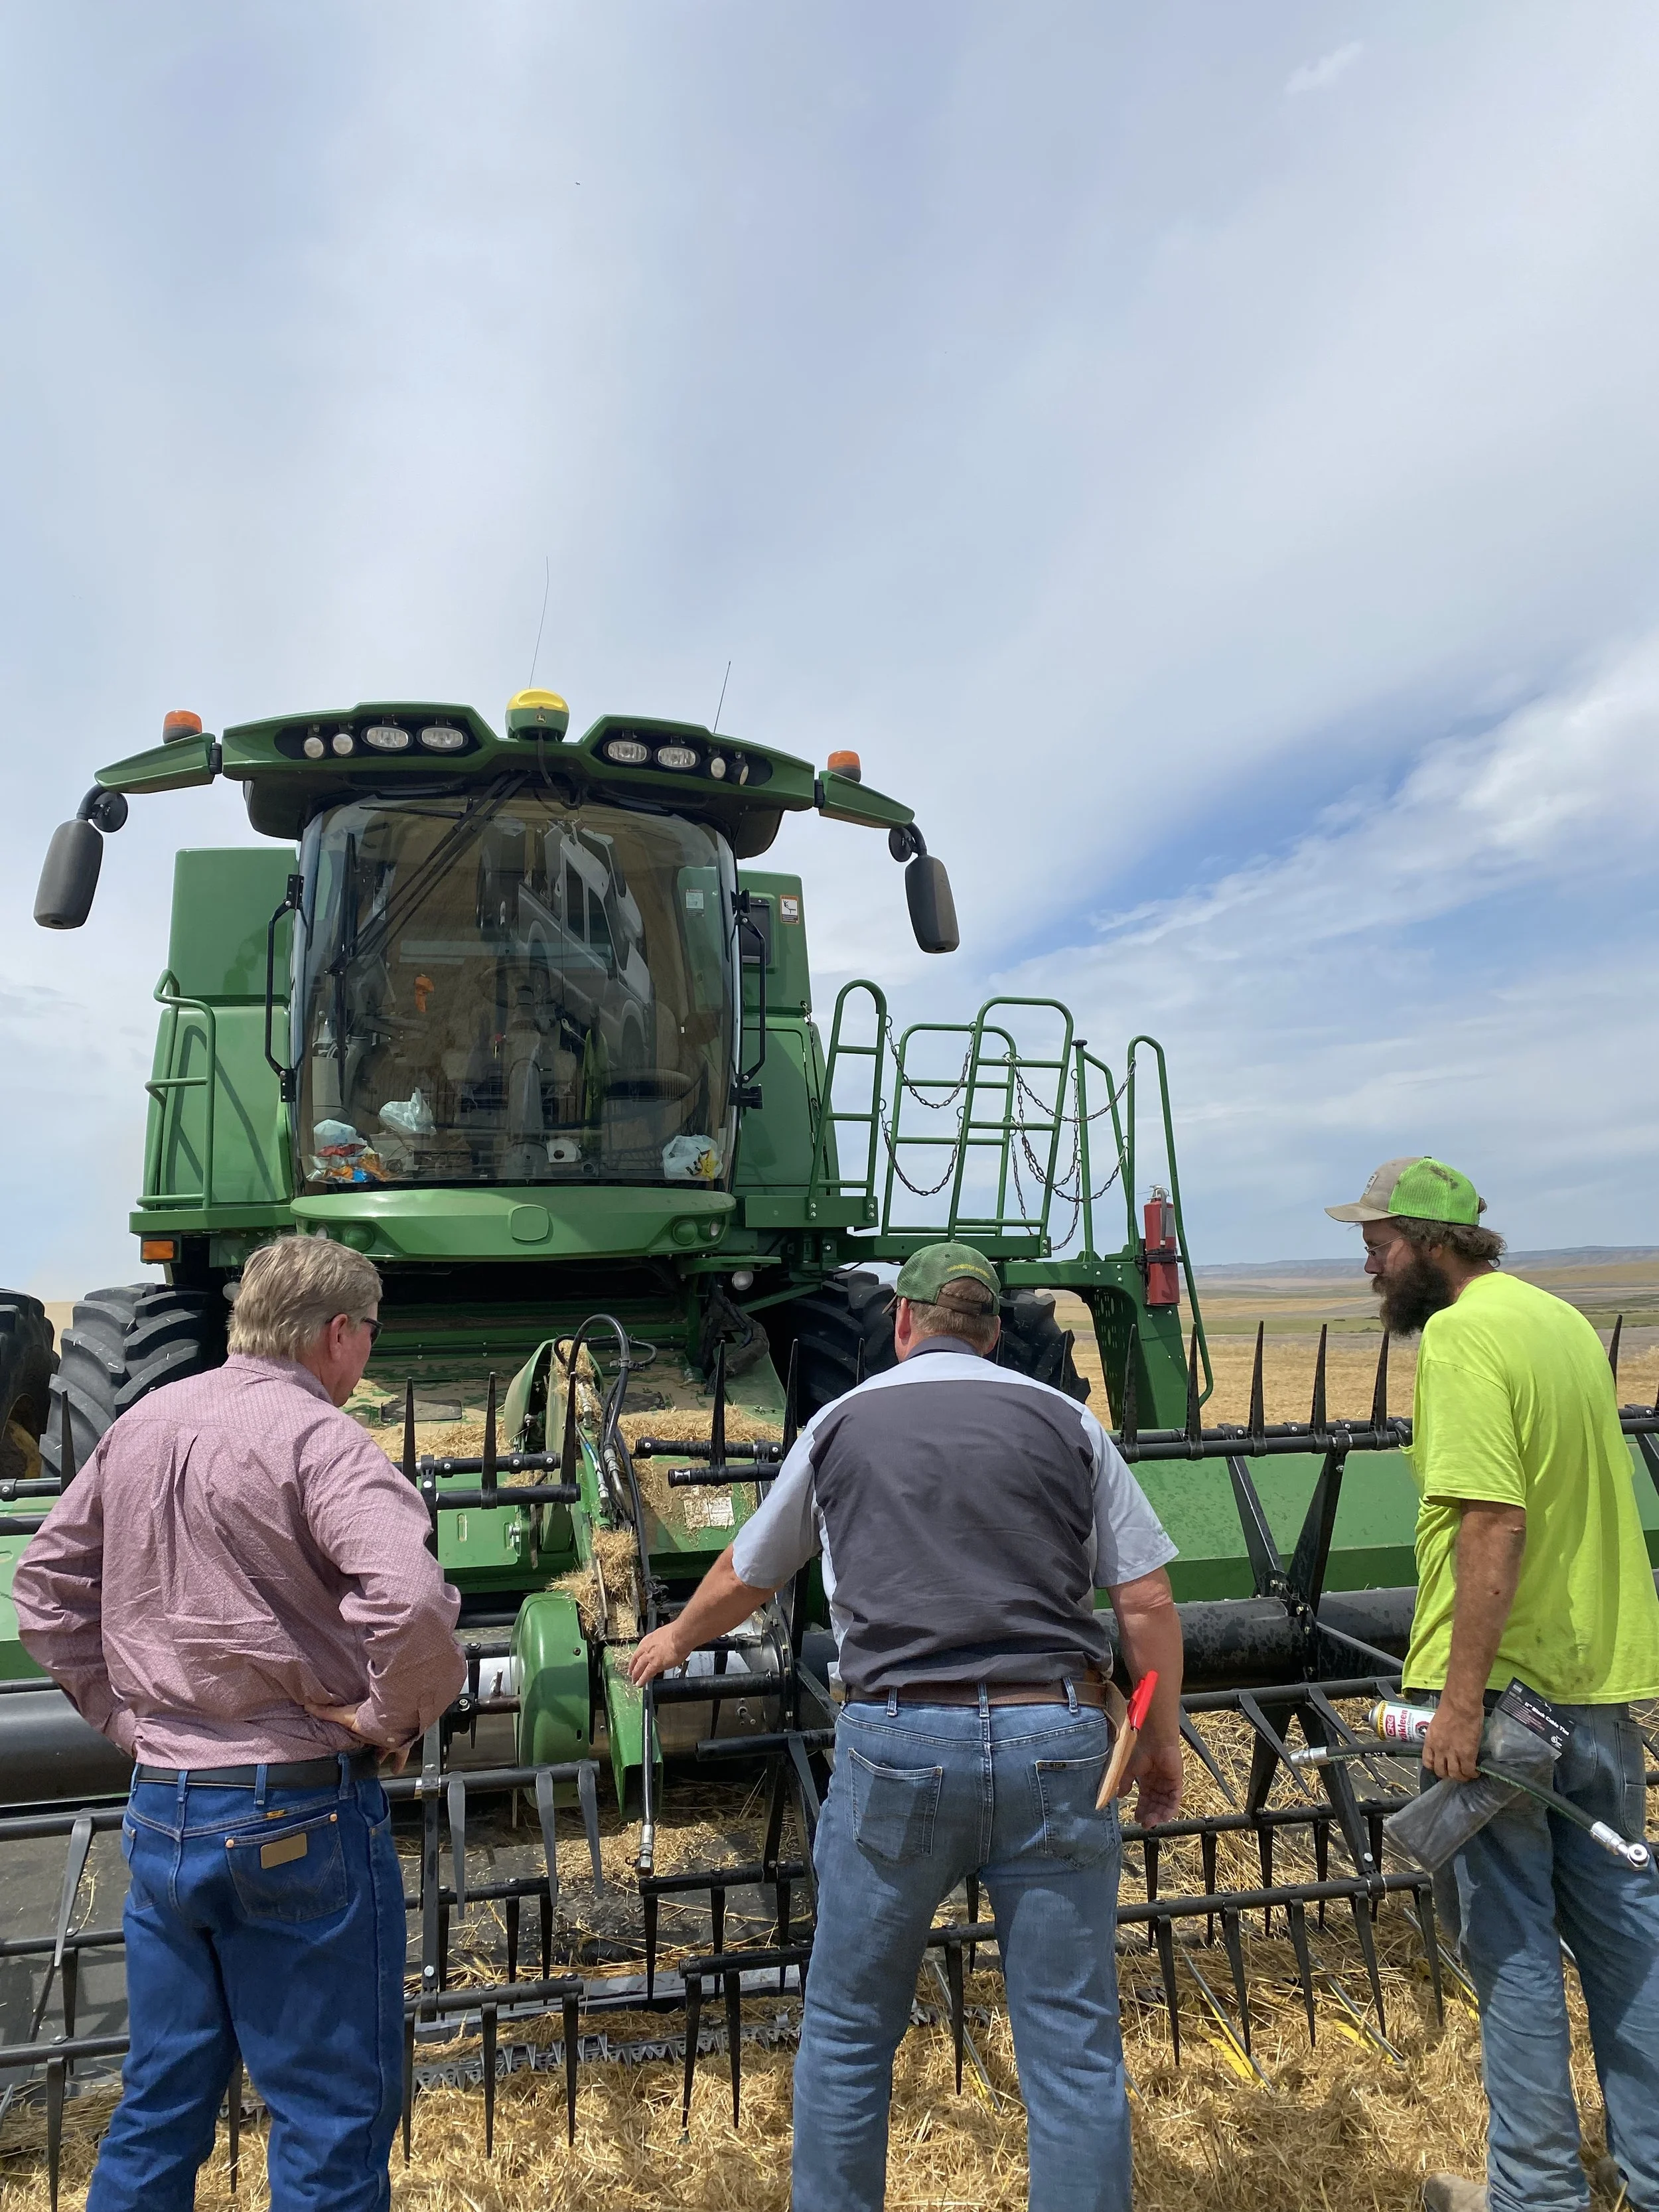
Customer Connections

Every row harvested was a reminder that our work affects real people. These images represent my commitment to understanding the customer experience in its truest form - side by side in the field.

A green combine harvester harvesting crops in a farmland at sunset.
Three farmers or workers working on a large green piece of farming equipment in a field, with a blue sky and some clouds above.
A green combine harvester working in a wheat field on a sunny day under a blue sky with some clouds.